
Graph of Linear Equations in two Variables
Graph of Linear Equations in two Variables: Overview
This topic covers concepts such as Graph of a Linear Equation in Two Variables, Equations of Lines Passing through the Origin, Equation of x-axis, and Equation of y-axis.
Important Questions on Graph of Linear Equations in two Variables
In the following questions, two equations numbered I and II are given. You have to solve both the equations and Give an answer If
Or the relationship cannot be established
I.
II.
A rabbit covers metres distance by walking metres in slow motion and the remaining by jumps, each jump contains metres. Express this information
in linear equation.
The graph of the linear equation cuts the x-axis at the point.
Use the table given alongside to draw the graph of a straight line. Find, graphically, the values of and .
The equation of -axis is:
The point lies
The distance between the graph of the equations and is
The equation of this graph is-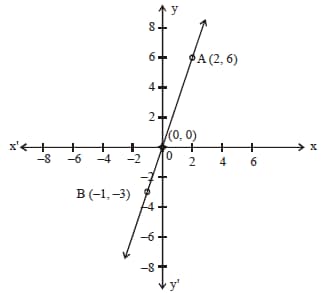
The graphs of the equations and intersect at the point . What is the value of ?
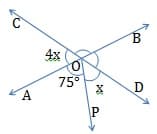
Find the value of in the figure, if two straight lines AB and CD intersect each other O. (given )
Every point on the line representing the equation the linear equation in two variables.
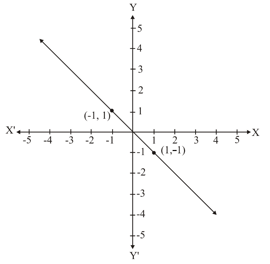
From the choices given below, choose the equation of the line:
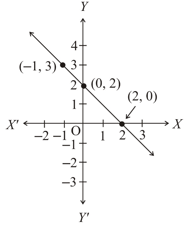
From the choices given below, choose the equation whose graph given below:
Which of the following statement is true?
Area of the region formed by is


